What a thousand metres of climb actually costs
When you’re sitting on a race page working out whether you can run that 50K and still be back for dinner, distance is the part you can judge. Most of us know roughly what 50 km takes us. The elevation figure underneath it is harder to translate. Everyone knows more climbing means more time on your feet, but the useful question is how much, and 21,000 trail races answer it fairly precisely.
Across 405 flat 50Ks and 1,996 steep ones, the median finisher takes just over six hours on the flat and just over nine on the steep. Same distance, three hours apart. That’s not a different race, it’s a different day.
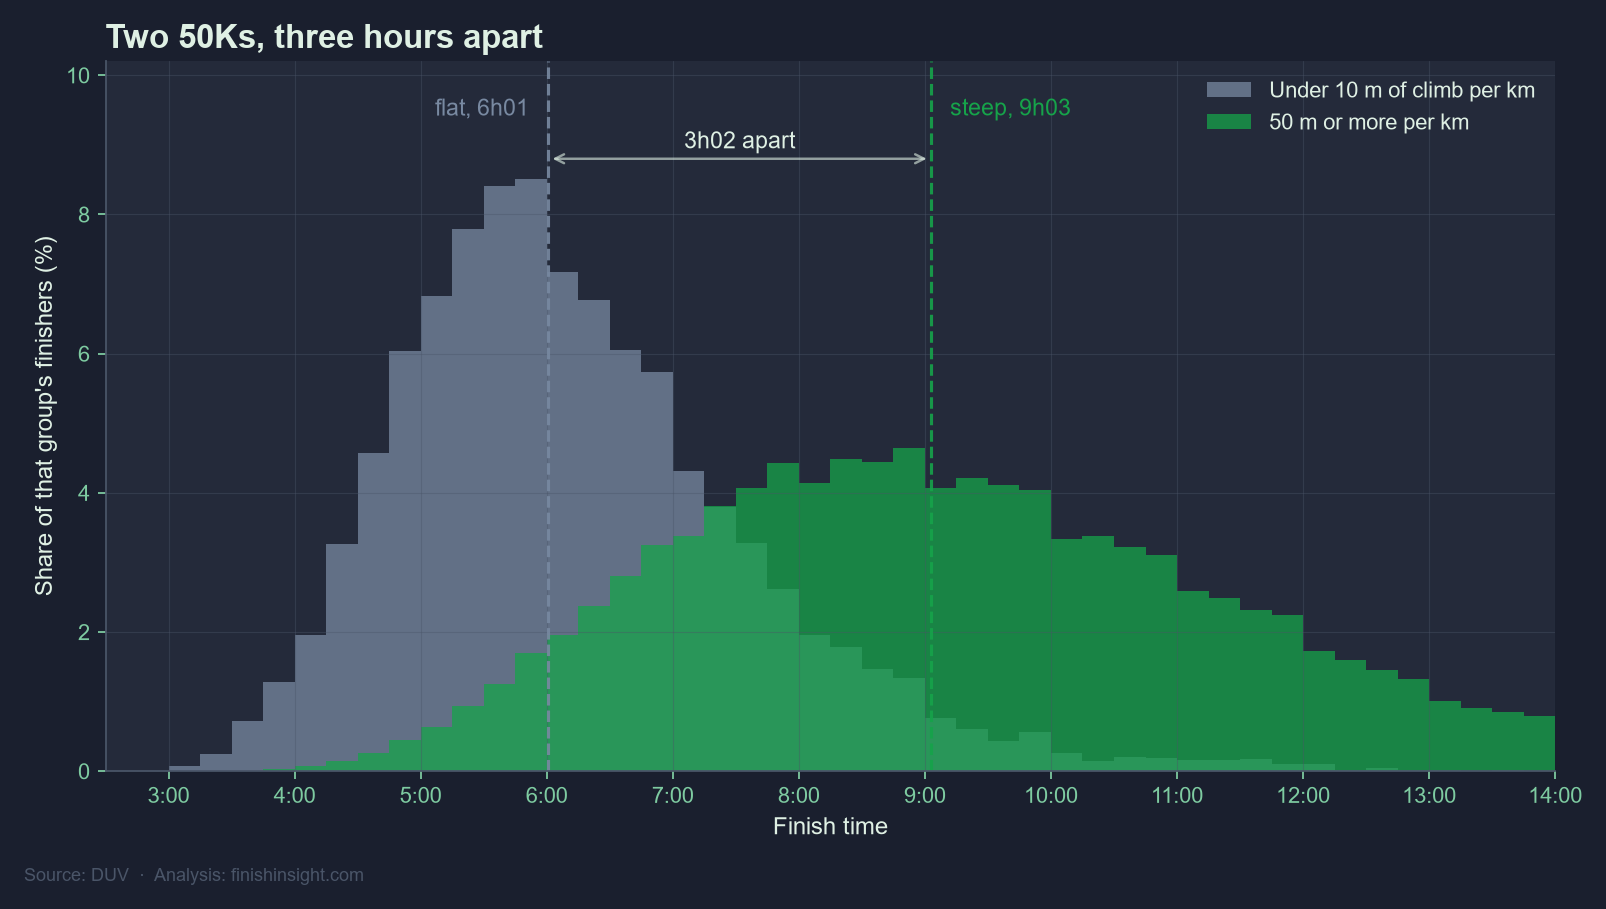
That’s trail races only, from DUV, finishers only. Road and track almost never record their elevation, so anything wider would mostly be measuring which race directors fill in an optional field.
You might expect this to be a 50K quirk, the shortest of the ultras being the one where terrain has room to dominate. It isn’t. Same shape at 50 miles, 100K and 100 miles, across 21,000 races.
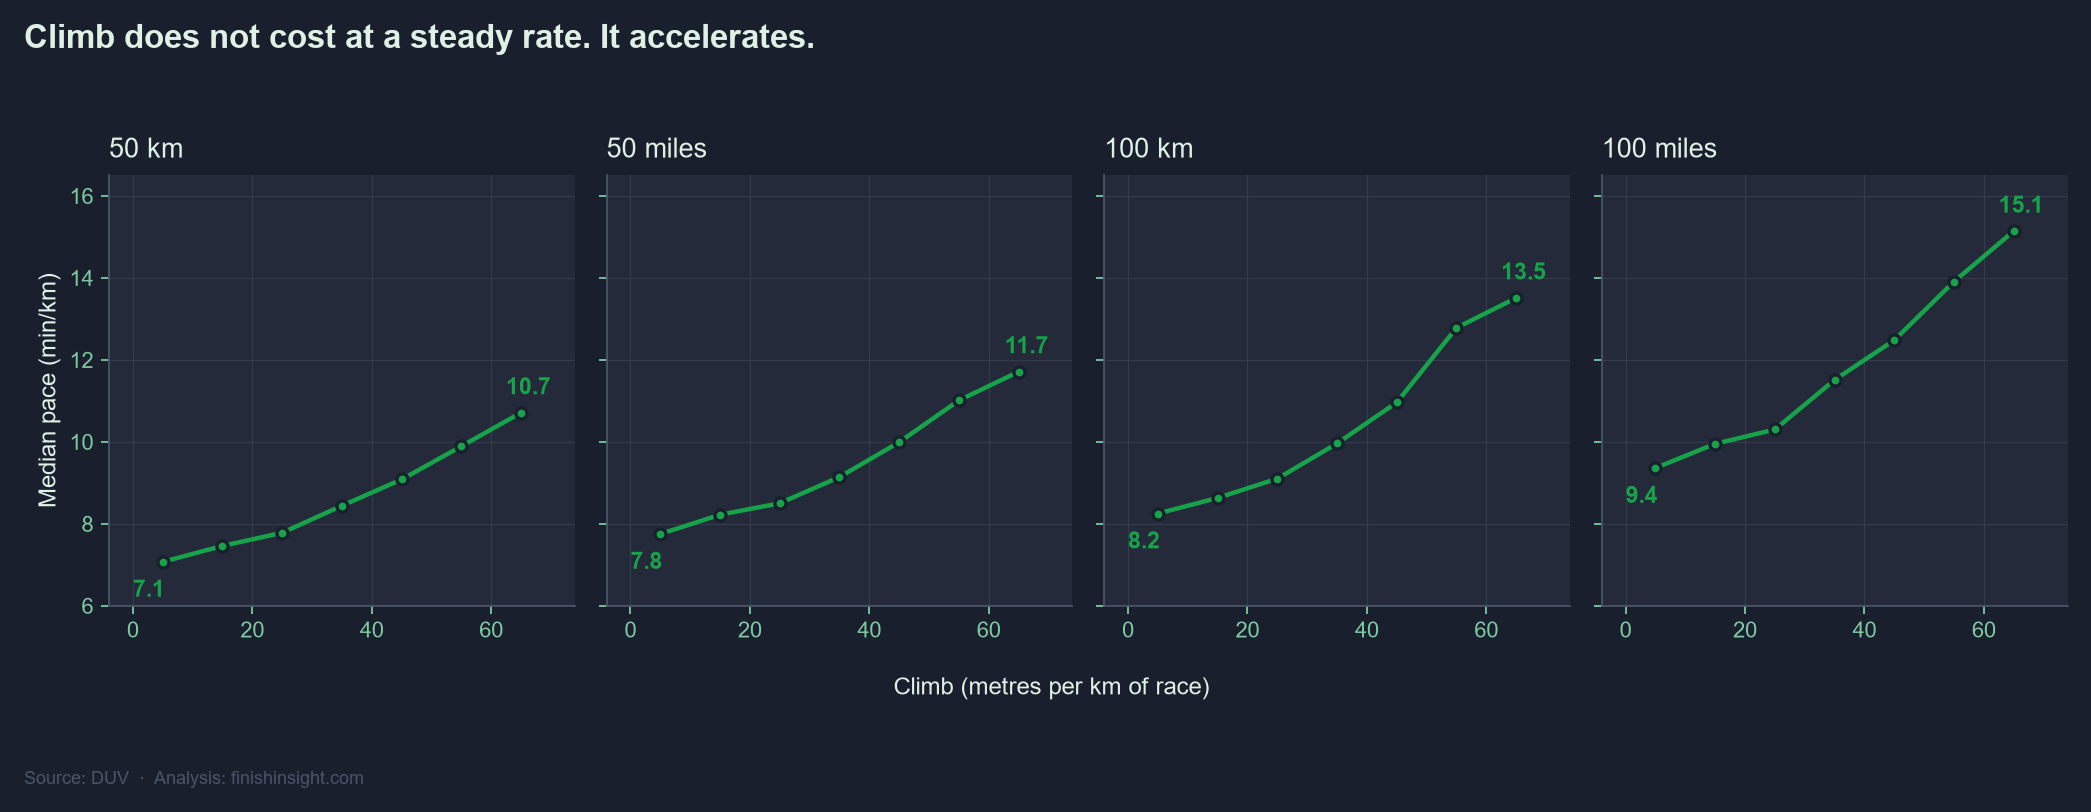
Look at the shape of those lines though. None of them are straight. They all bend upward, and the bend is the important part.
Two things decide how long you’re out there: how far you go, and how much you climb. Most of us have a reasonable feel for the first and very little for the second, and the second doesn’t scale the way you would expect.
On gentle ground, under about 25 m of ascent per kilometre, every extra 1,000 m costs you around 40 minutes. Push into proper mountain terrain, above 45 m per km, and the same 1,000 m costs two hours or more. Same metres of ascent, close to three times the cost.
Put that in finish times and it stops being abstract. The same 100K, at different amounts of climb:
| Total climb | Median finish |
|---|---|
| 500 m | 13h45 |
| 1,500 m | 14h25 |
| 2,500 m | 15h10 |
| 3,500 m | 16h35 |
| 4,500 m | 18h15 |
The first 2,000 m of climb adds about an hour and twenty-five minutes. The next 2,000 m adds more than three hours. Identical ascent, more than twice the cost.
The gap gets big enough to invert things. A steep 50 miler will keep you out longer than a flat 100K, 15h45 against 13h45, on nearly 20 km less ground.
Those are whole fields, not you. If you want a number for your own race, the finish time tool will look it up: pick the race, add a recent result, and it works out what your usual place in the field is worth on that terrain.
The obvious worry is that this measures paperwork rather than mountains. If flat races skip the elevation box, the flat end is missing and all of this is inflated. They don’t. Races with no elevation recorded are slower than the flattest races that do record it, which puts them mid-range rather than at the bottom.
What “steep” actually means is murkier. Rocks, scree, exposure, and thin air at 3,000 m where your legs are fine and your lungs aren’t. A 1,000 m climb up a grassy Yorkshire hill and 1,000 m in the Rockies are not the same 1,000 m, and nothing in the results separates them. So steep races cost more per metre climbed. Whether the gradient alone is doing it, this data can’t say.
And these are finishers. Anyone the mountain sent home isn’t in here at all, so if anything this is the optimistic version.
None of that changes the practical answer. Next time you’re weighing up a race, the distance tells you how far you’re going. The elevation tells you how long you’ll be out there.
Data from DUV, as at August 2026: 21,095 trail races across the 50K, 50 mile, 100K and 100 mile distances with a recorded elevation gain. Paces are medians of race medians, so one very large event can’t set the trend. Races recording more than 100 m of climb per km are excluded as parser errors, 143 of them, 0.64%. Finishers only; DUV does not publish DNF data.